Stencils tagged with ‘ts’
Events Overview (Magnolia CMS)
Events Overview Paragraphs stencil from the Magnolia CMS Standard Templating Kit (STK) Stencil kit. Events Overview paragraphs make use of the hcalendar microformat.
Facebook Comments
Facebook comments and Facebook add a comment widget for websites.
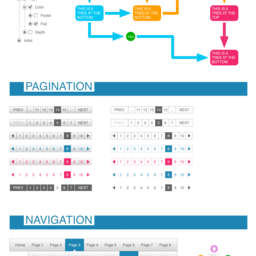
Flat UI Elements
A collection of web elements (components) for easy and fast wire-framing for all of your UI needs. This stencil includes drop-downs, pagination, radio buttons, checkboxes, and buttons, plus a few bonus icons and credit cards.
Flow callouts
Rounded rectangular callouts with semi-transparent gradience.
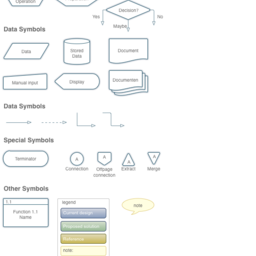
Flowcharting Symbology
Almost a complete set of flowchart symbols based upon ISO 5807:1985. With a few extra symbols. Symbols are measured in centimeters and are designed to be placed on a canvas with a major grid spacing of 2 cm and 8 minor grid steps. With thanks to radiorental for version 1.
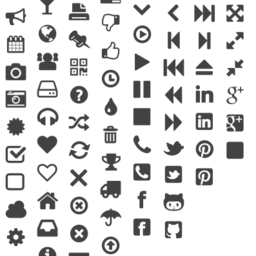
Font Awesome
Omnigraffle stencil of the popular vector font library, Font Awesome, tailored for use with Bootstrap. This was made with an earlier version of Font Awesome. If people are interested, then I can continue to update the stencil as Font Awesome updates.
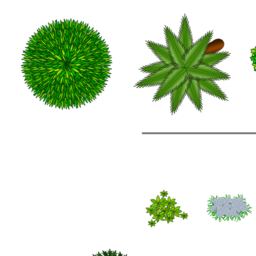
Gardening
Got a green thumb? You should probably get that checked out, you know. But if it turns out you aren't a flesh eating zombie, maybe you're horticulturally inclined and a prime candidate for enjoying the many, many (well "several") uses of our new Garden Stencil.
Gorgeous Charts and Graphs
A full set of charts and graphics for data visualization in a bold, beautiful, and gorgeous color palette. Included are bar charts, stacked bar charts, line charts, calendar views, bullet charts, pie charts, sparklines, bubble graphs, difference charts, area charts, gauges, a sankey diagram, funnel graph, scatter plot, stream...more
Grayscale Charts and Graphs
A full set of charts and graphics for data visualization in a grayscale color palette for wireframing. Included are bar charts, stacked bar charts, line charts, calendar views, bullet charts, pie charts, sparklines, bubble graphs, difference charts, area charts, gauges, a sankey diagram, funnel graph, scatter plot, stream...more


