Stencils tagged with ‘quality improvement’
Failure Modes and Effects Analysis
Nice, clean template for FMEA analysis. Beats the usual PowerPoint rendering.
Key Driver Diagram
Used as a reporting method within the discipline of quality improvement. Looks a while lot better than the usual PowerPoint rendering.
Lean Six Sigma Tools
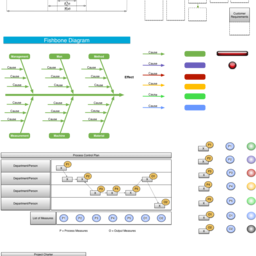
Continuous Process Improvement (CPI) tools for integrating into quality plans to include Define, Measure, Analyze, Improve, and Control (DMAIC) scientific model. Includes Bell Shaped Curve for plotting, Project Charter Matrix, Fishbone Diagram showing root causes, SIPOC Chart and Process Control Plan. Soon to come: Weighted...more
Model for Improvement
A basic diagram to introduce the conceptual foundations of quality improvement
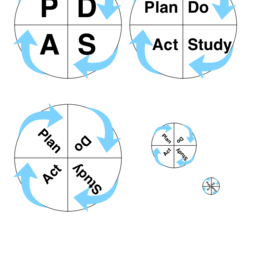
PDSA Cycle Graphic
For use in quality improvement documents, several versions of the graphical image depicting the "Plan-Do-Study-Act" cycle.


