Stencils tagged with ‘graphs’
Business Charts and Graphs
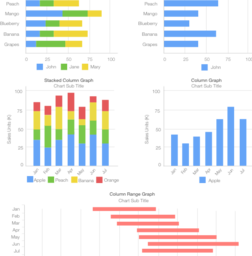
A full set of charts and graphics for data visualization in a subdued and professional color palette ideal for business. Included are bar charts, stacked bar charts, line charts, calendar views, bullet charts, pie charts, sparklines, bubble graphs, difference charts, area charts, gauges, a sankey diagram, funnel graph,...more
Charts and Graphs - Grayscale
A beautiful Omnigraffle stencil with a set of charts and graphs in grayscale, ideal for data visualization, designed specifically for wireframing. This set includes a variety of line charts, area charts, stacked bar charts, bar charts, pie charts and gauges. Perfect for wireframing anything from dashboards to analytic...more
Charts & Graphs
Charts and Graphs for User experience and wireframe designing
Flat and Cool UI
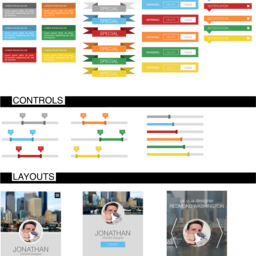
Responsive web and flat UI design is the current trend. This file satisfies that trend giving you all of the components and web elements needed that is responsive-ready! Graphs, buttons, checkboxes, drop downs, search boxes, notifications, radio buttons, controllers, sign in form, CTAs (call to actions), hero, register form...more
Gorgeous Charts and Graphs
A full set of charts and graphics for data visualization in a bold, beautiful, and gorgeous color palette. Included are bar charts, stacked bar charts, line charts, calendar views, bullet charts, pie charts, sparklines, bubble graphs, difference charts, area charts, gauges, a sankey diagram, funnel graph, scatter plot, stream...more
Grayscale Charts and Graphs
A full set of charts and graphics for data visualization in a grayscale color palette for wireframing. Included are bar charts, stacked bar charts, line charts, calendar views, bullet charts, pie charts, sparklines, bubble graphs, difference charts, area charts, gauges, a sankey diagram, funnel graph, scatter plot, stream...more
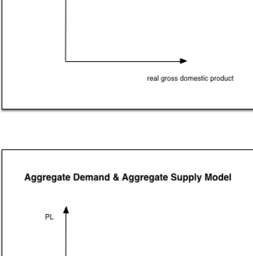
Macroeconomics - Aggregate Demand and Aggregate Supply Basic Graphs
This is my first attempt to use OmniGraffle to produce standard graphs used in AP Macroeconomics courses. I started with a basic set of Aggregate Demand and Aggregate Supply graphs.


