Stencils tagged with ‘graph’
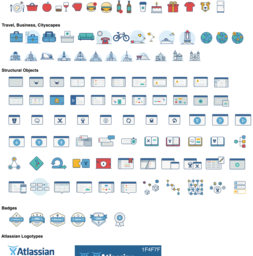
Atlassian Iconography
These Icons are extracted from a shared Atlassian pptx. Atlassian Presentation Template - PowerPoint.zip from http://bit.ly/2k7IcRW (Dropbox) They’re all PNG with a transparent background. Nothing is known about the re-using constraints.
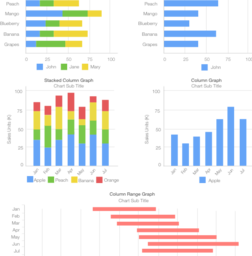
Business Charts and Graphs
A full set of charts and graphics for data visualization in a subdued and professional color palette ideal for business. Included are bar charts, stacked bar charts, line charts, calendar views, bullet charts, pie charts, sparklines, bubble graphs, difference charts, area charts, gauges, a sankey diagram, funnel graph,...more
Charts and Graphs - Grayscale
A beautiful Omnigraffle stencil with a set of charts and graphs in grayscale, ideal for data visualization, designed specifically for wireframing. This set includes a variety of line charts, area charts, stacked bar charts, bar charts, pie charts and gauges. Perfect for wireframing anything from dashboards to analytic...more
Charts & Graphs
Charts and Graphs for User experience and wireframe designing
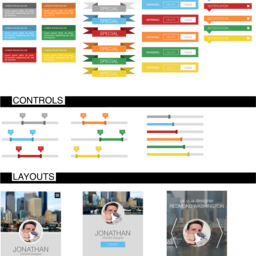
Flat and Cool UI
Responsive web and flat UI design is the current trend. This file satisfies that trend giving you all of the components and web elements needed that is responsive-ready! Graphs, buttons, checkboxes, drop downs, search boxes, notifications, radio buttons, controllers, sign in form, CTAs (call to actions), hero, register form...more
Gorgeous Charts and Graphs
A full set of charts and graphics for data visualization in a bold, beautiful, and gorgeous color palette. Included are bar charts, stacked bar charts, line charts, calendar views, bullet charts, pie charts, sparklines, bubble graphs, difference charts, area charts, gauges, a sankey diagram, funnel graph, scatter plot, stream...more
Graph Model
Model your use-case data as a graph (e.g. Neo4j).
Grayscale Charts and Graphs
A full set of charts and graphics for data visualization in a grayscale color palette for wireframing. Included are bar charts, stacked bar charts, line charts, calendar views, bullet charts, pie charts, sparklines, bubble graphs, difference charts, area charts, gauges, a sankey diagram, funnel graph, scatter plot, stream...more
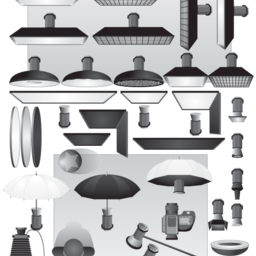
Lighting Diagrams for Photography - Strobist
useful diagrams for doing studio and on location lighting setups for photography. Ported to omnigraffle from an original PSD created by Kevin Kertz and originally published at: http://www.fredmiranda.com/forum/topic/446987/0 Ported to Omnigraffle for convenience, and Kevin's original usage restrictions apply.


