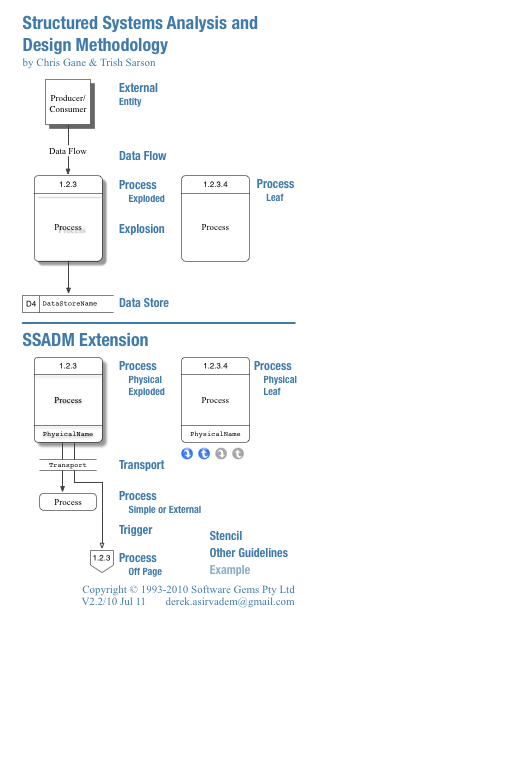
Data Flow Diagram (SSADM)
The classic Structured Systems Analysis and Design Methodology by Chris Gane and Trish Sarson. SSADM is better known as Data Flow Diagrams. It is a simple and highly effective systems analysis and design (decomposition) methodology. It uses just four symbols, and it is excellent for communicating with non-technical users. A proposed or existing system can be analysed and decomposed to the level required (the deeper levels being more technical), which assists in exposing efficiency, modularity and duplication issues. Notes and guidelines are included (drag the stencil to its full size and hover over the labels), and a few extensions to the standard are provided. In the early stages, an Entity Relation Diagram (first page) is useful (for which there is an ERD stencil); as the analysis and design progresses, a full Data Model (starts on the second page) is more appropriate (for which there is an Data Model (IDEF1X) stencil). Stencil Version 2.2/10 Jul 11 (I make improvements and maintain the stencil on Graffletopia.) Please send feedback to derek.asirvadem@gmail.com
Questions? Read more about
installing stencils.
Works with

14,223 downloads
62 favorites